Returning customers
Know how many vehicles come back, and how often. Today that’s invisible unless someone uses a loyalty card.
Oil Vision
Forecourt Intelligence
An idea for Jio-bp Kerala
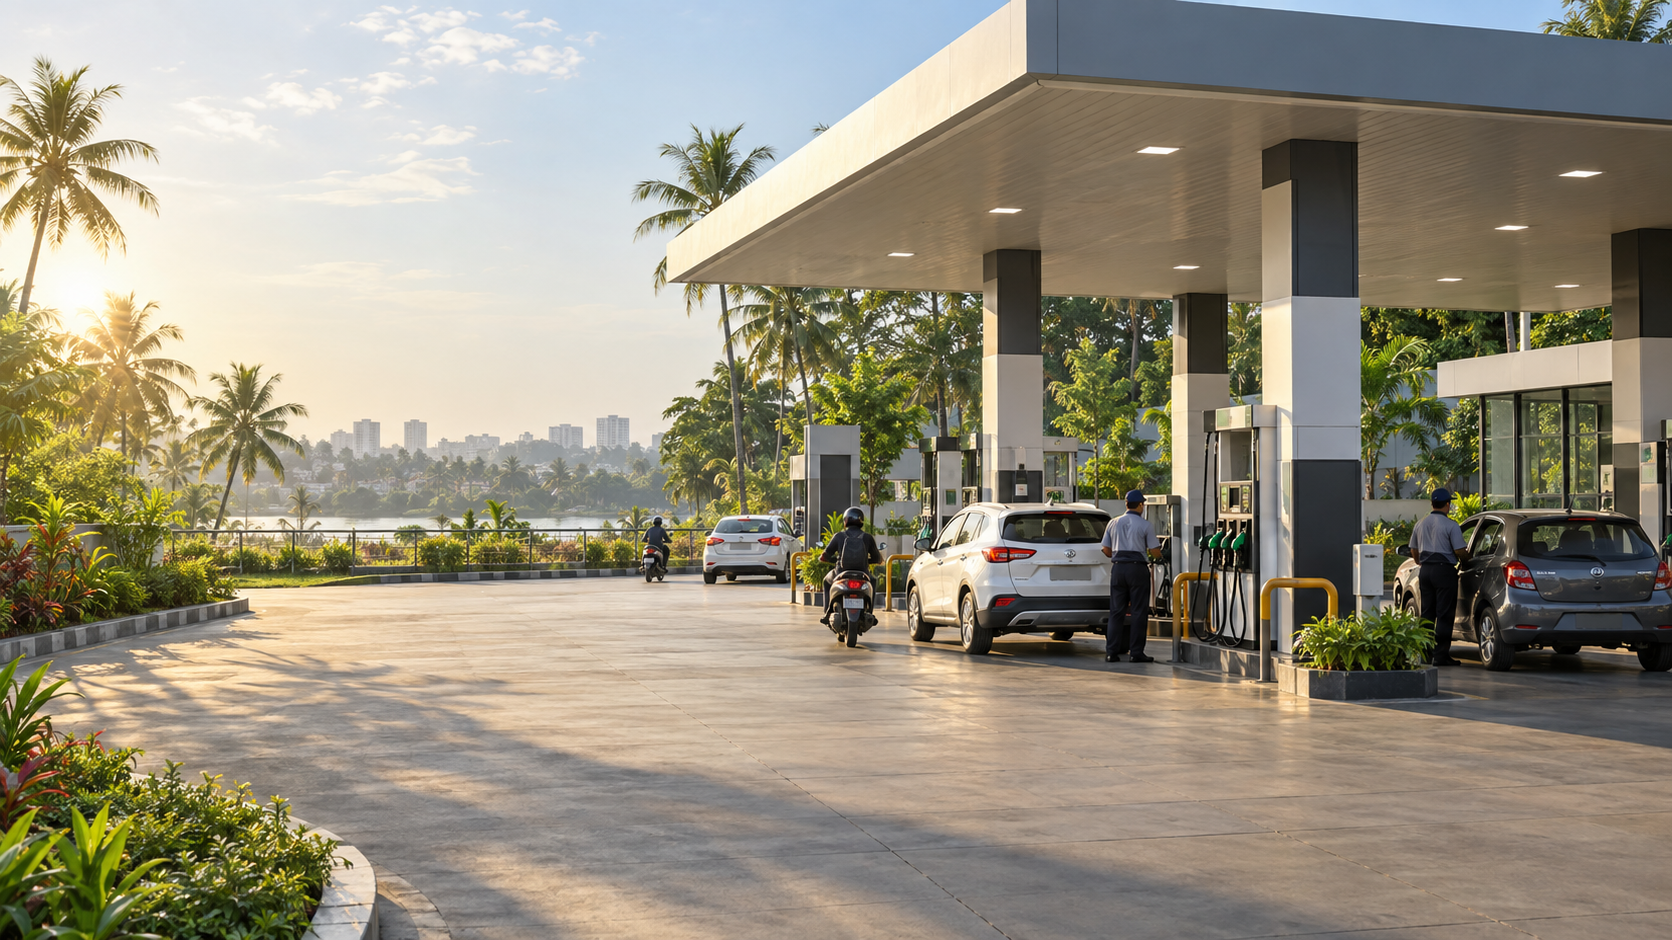
A simple idea: at each station, quietly count the vehicles that come in — type, time, and whether they’ve been here before. No cameras on people. No customer records. Just an honest picture of how a forecourt is actually used.
Concept only · Synthetic data · Not connected to any live camera, customer or government system
From individual visit
To network intelligenceHow it works
01
A car or two-wheeler pulls into the station.
02
Time, vehicle type, and whether this vehicle has visited before. Nothing personal.
03
The station sees patterns: busy hours, vehicle mix, how many customers return.
04
Better staffing, better stock, better offers, better planning.
What it could do
This isn’t about watching customers. It’s about knowing how a station is actually used — something we currently guess at.
Know how many vehicles come back, and how often. Today that’s invisible unless someone uses a loyalty card.
See the real busy hours and vehicle mix. Staff and stock the forecourt to match.
Compare stations properly. Spot which ones are stretched and which have room.
Understand who returns regularly, and test offers on fuel, convenience and services against real patterns.
Rough numbers
None of this is a forecast. It’s a small model built on public fuel-retail figures, so the scale of the idea can be sanity-checked rather than taken on trust. Change the assumptions — the numbers change with them.
A station selling around 330 kL of fuel a month sees roughly 650 vehicles a day. Most of its margin comes from volume, not per-litre. Which is why knowing the busy hours — and who comes back — matters more than it sounds.
Visits a month
19.5 lakhIllustrativeacross the stations selectedReturning vehicles spotted
6.8 lakhIllustrativeanonymous, no identity attachedOpted-in customers reachable
2.9 lakhIllustrativeonly where a customer has agreedA measurable base of regulars, where today there’s only a guess.
Peak pressure becomes visible, so staffing and lane flow can follow it.
Which stations are stretched, and which have room.
If regulars were engaged better. Arithmetic, not a forecast — the rupee version sits in the disclosure.
Grounding ballparks · approximate public ranges, illustrative. National average outlet throughput works out to roughly 100–150 kL a month (PPAC fuel-sales data ÷ ~87,000–90,000 retail outlets), so 330 kL marks a well-performing site · dealer commission runs ≈ ₹3,100/kL on petrol and ₹2,300/kL on diesel plus a price-linked component — about ₹3–4/L and ₹2–3/L (Business Today, Mar 2026) · Kerala petrol ≈ ₹115.49/L, diesel ≈ ₹98/L (Goodreturns tracker, 12 Sep 2026) · non-fuel conversion is single-digit in India versus 20–50% at mature international forecourts (convenience-retail industry reporting) · mature fuel-loyalty programmes link 25–40% of transactions to a loyalty identifier, Indian programmes often 10–20% (industry reporting) · typical non-fuel basket ₹150–350.
Sources
Assumed constants: blended fill ~17 L · blended fuel price ~₹106/L · dealer margin ~₹2.8/L · busiest-hour share 12% · comfort level ~90 vehicles per busiest hour · baseline non-fuel conversion 5% · response base 5% · basket ₹200. Benchmarks are public ranges — the pilot would replace them with measured values.
What we’re asking for
No funding, no procurement, no commitment beyond the pilot. Just permission to set this up at a site or two and see whether the numbers hold up. If they don’t, that’s a useful answer too.
Three different kinds of site would tell us the most:
Worst case, we learn what doesn’t work, at one station, at no cost.
Peak demand, queues, regular customers
Passing traffic, longer stops, different mix
The hardest case, and the most common one
Built to be defensible. Vehicles are counted, not identified. Anything linked to a person requires that person to opt in, separately. No customer data is sold, shared or resold — that’s a design decision, not a policy statement.